McKesson ERA - My Filters
Role: UX Designer & UI Lead
Tools: Figma, Miro
Platform: McKesson Enterprise Reporting and Analytics (ERA) - Power BI or Looker
Team: Worked alongside the UX and research team, PMs, and stakeholders
What is ERA?
Self-service analytics platform
ERA is McKesson’s enterprise-grade, self-service reporting and analytics solution. It provides users with an intuitive interface to access and analyze their operational, financial, and purchasing data with minimal IT support.Designed for pharmacy and healthcare operations
Targeting wholesalers, pharmacies, specialty clinics, and provider organizations, ERA integrates with McKesson Connect to deliver real‑time insights into drug purchases, supply usage, invoicing, and spend categories.
What is My Filters?
“My Filters” in ERA lets users save personalized filter criteria—such as date ranges, supplier names, cost centers, product groups, and more—to quickly apply them across multiple reports and dashboards. This streamlines data segmentation by keeping your preferred filters at your fingertips. Users can manage and reuse their tailored filters whenever needed.
My Role & Responsabilities
As the UX Designer for the My Filters feature within the McKesson ERA analytics platform, I led a complete redesign of the experience with the goal of making filtering more intuitive, powerful, and user-friendly for both novice and advanced users.
To ensure the redesign met real user needs, I conducted extensive user research, including stakeholder interviews, workflow observations, and usability testing sessions with pharmacy operations staff and data analysts. Insights from this research directly informed the design strategy and helped prioritize the most impactful features.
Problem
The original filtering interface was functional but:
Lacked usability for repeated or complex filter workflows.
Offered limited personalization or sharing options.
Required repetitive setup of common filters across reports.
Had a dated UI with little flexibility for evolving needs.
People Involved
2 product designers
2 UX/UI
2 developer
1 project manager
Analytics
Competitor analysis
We compared the most well-known and efficient data visualization tools that matched our needs and compared their features.
We compared the most well-known and efficient data visualization tools that matched our needs and compared their features.

Mapping the experience
Then we created possible flows
First who mapped the present flow
Wireframing
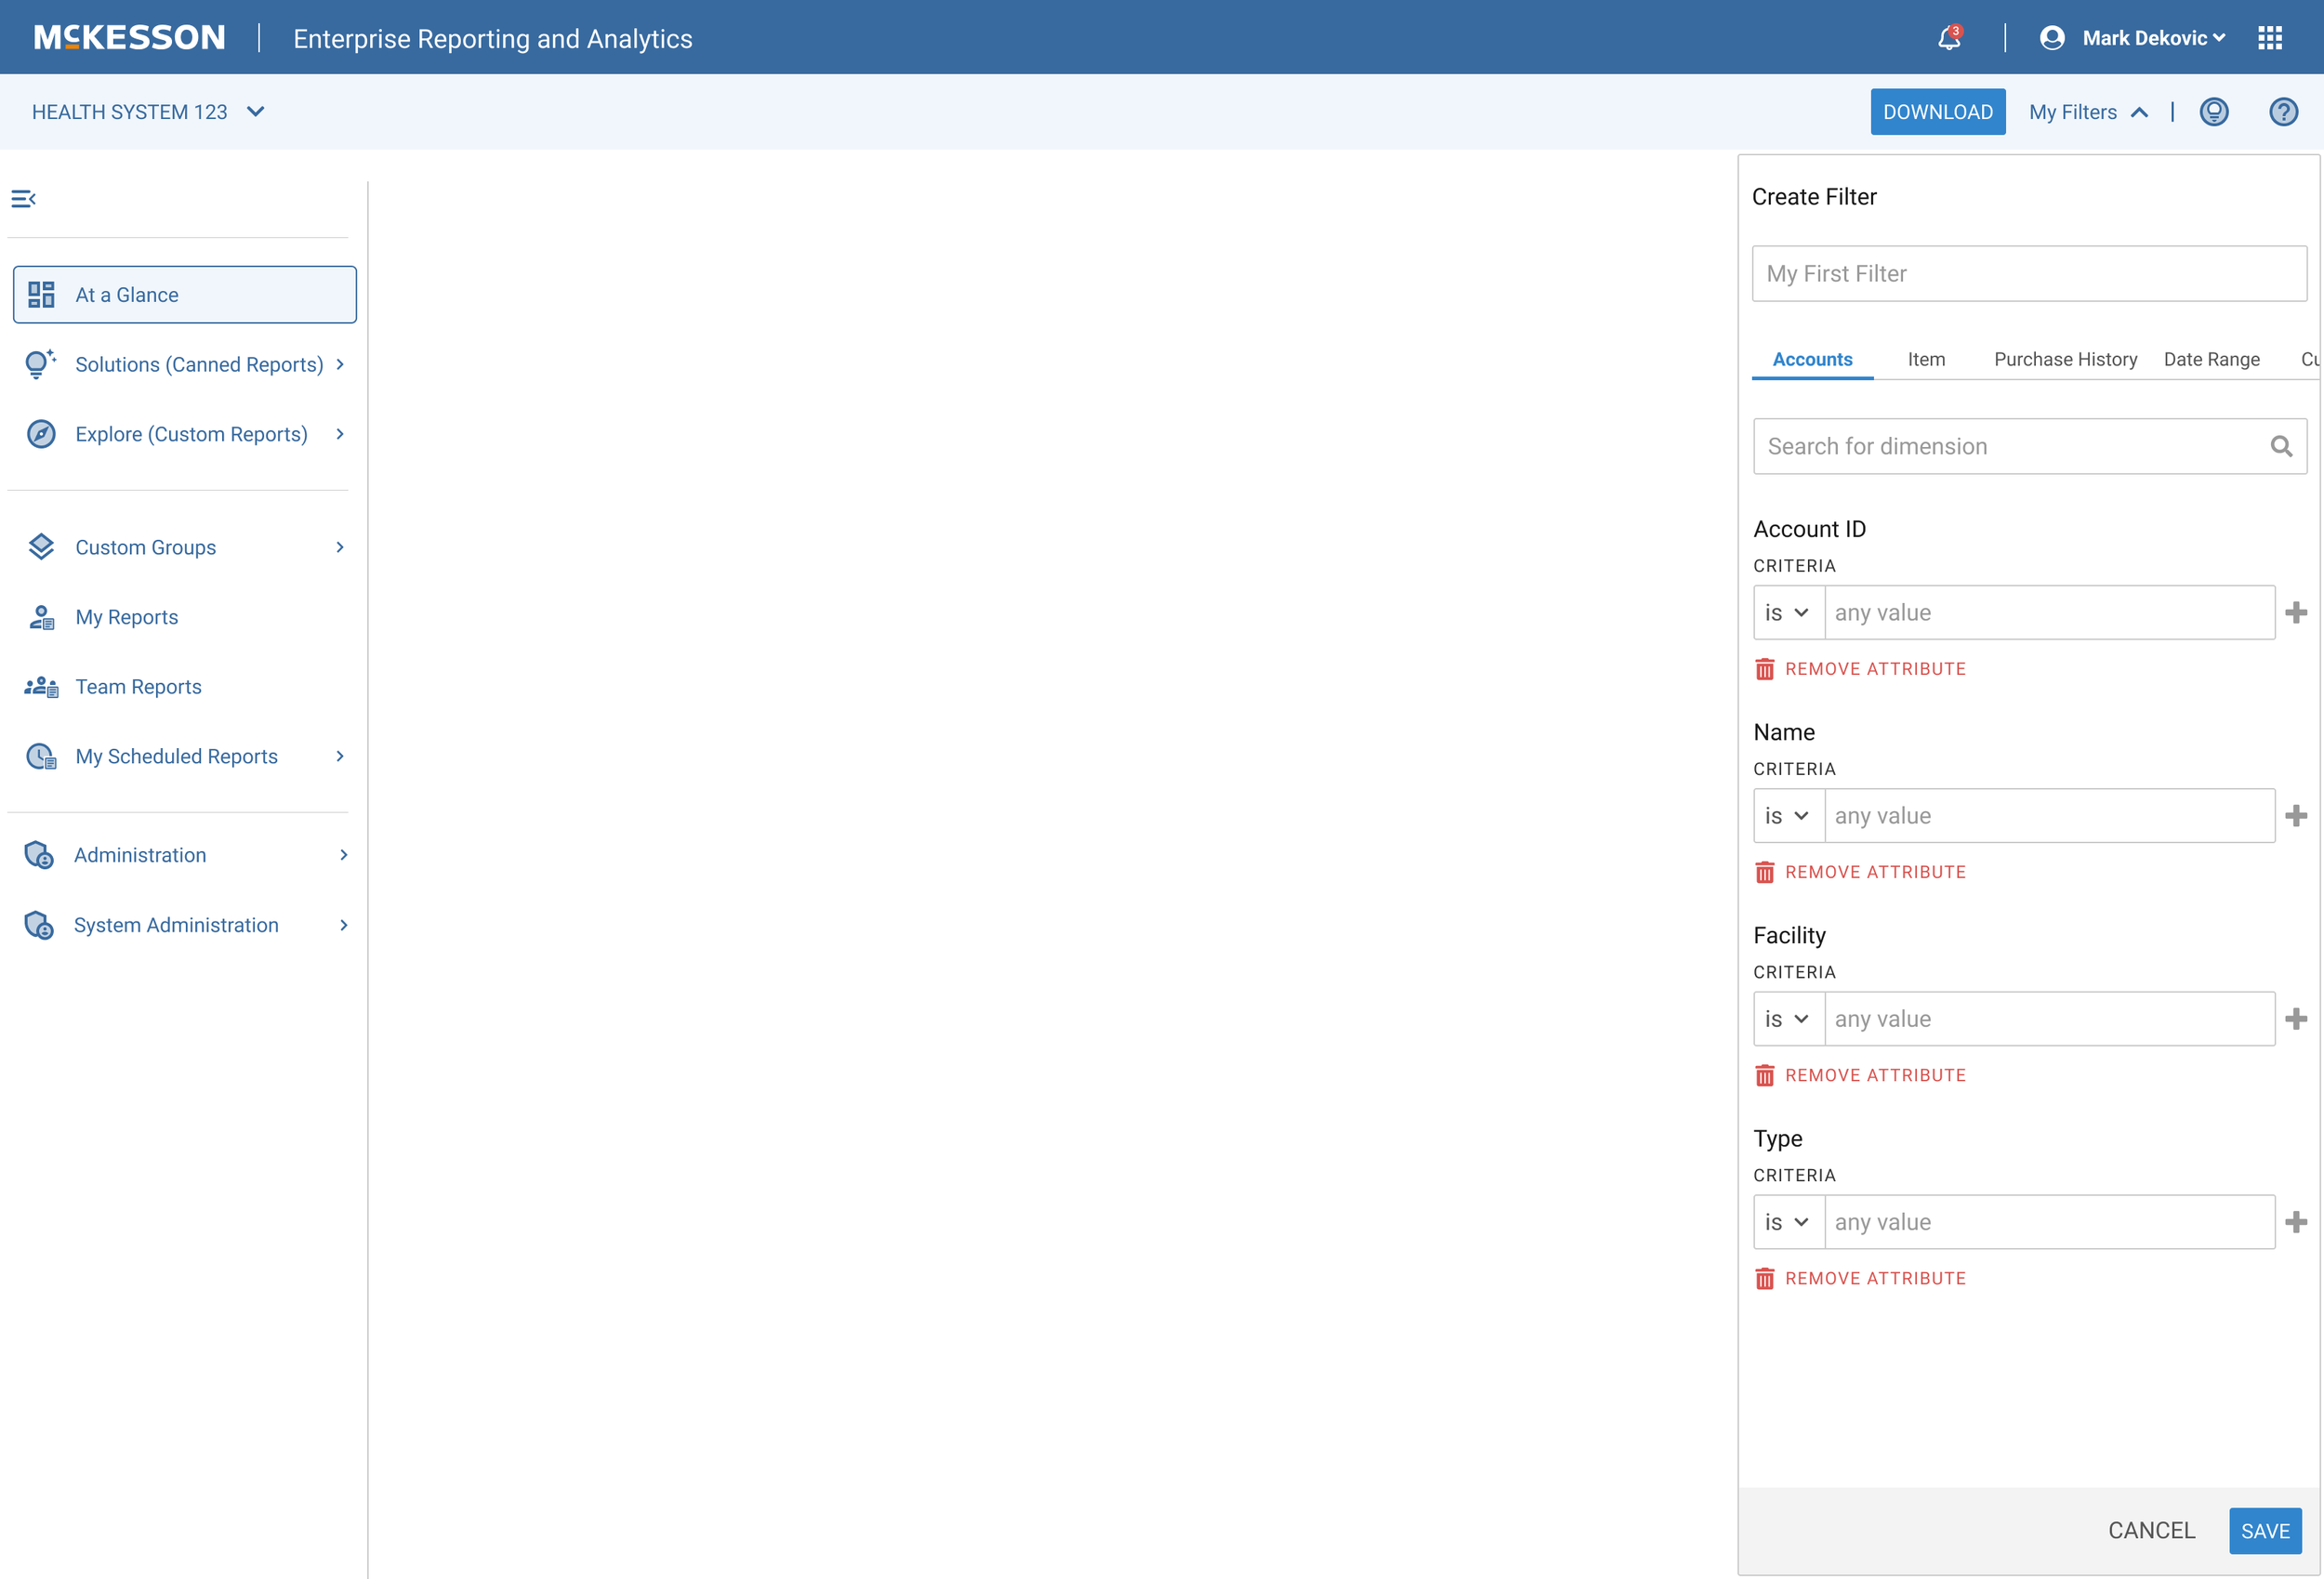
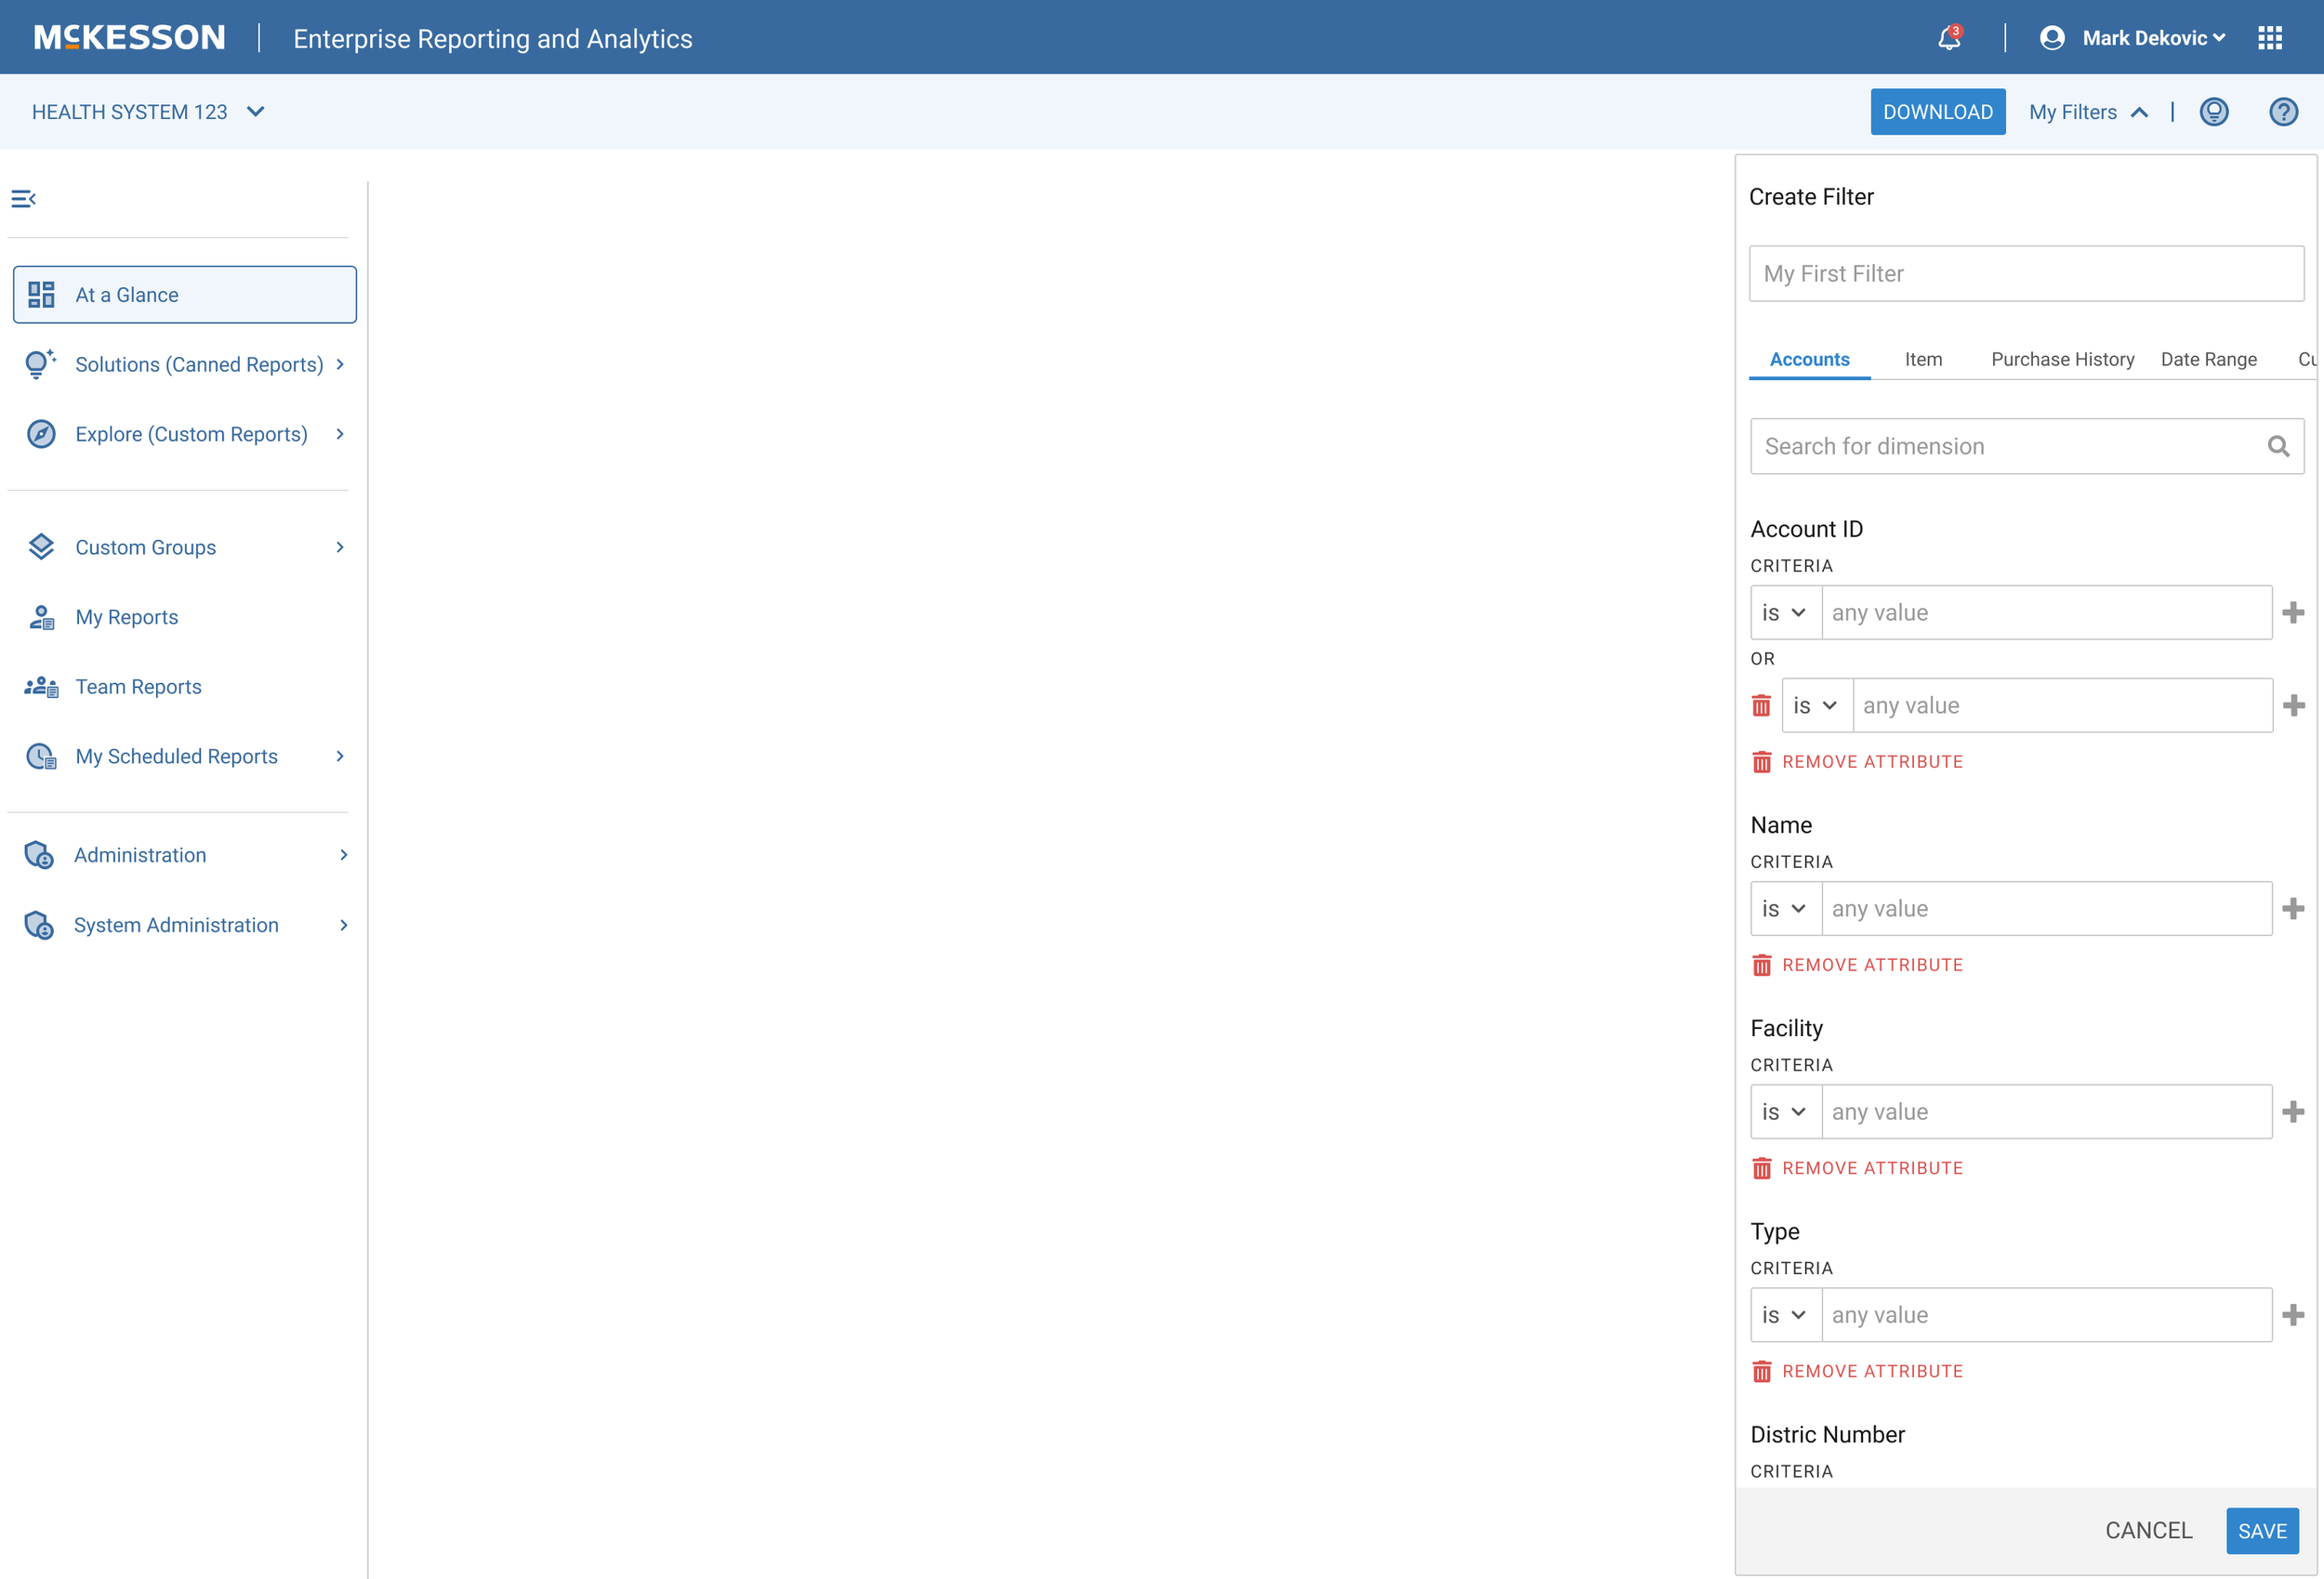
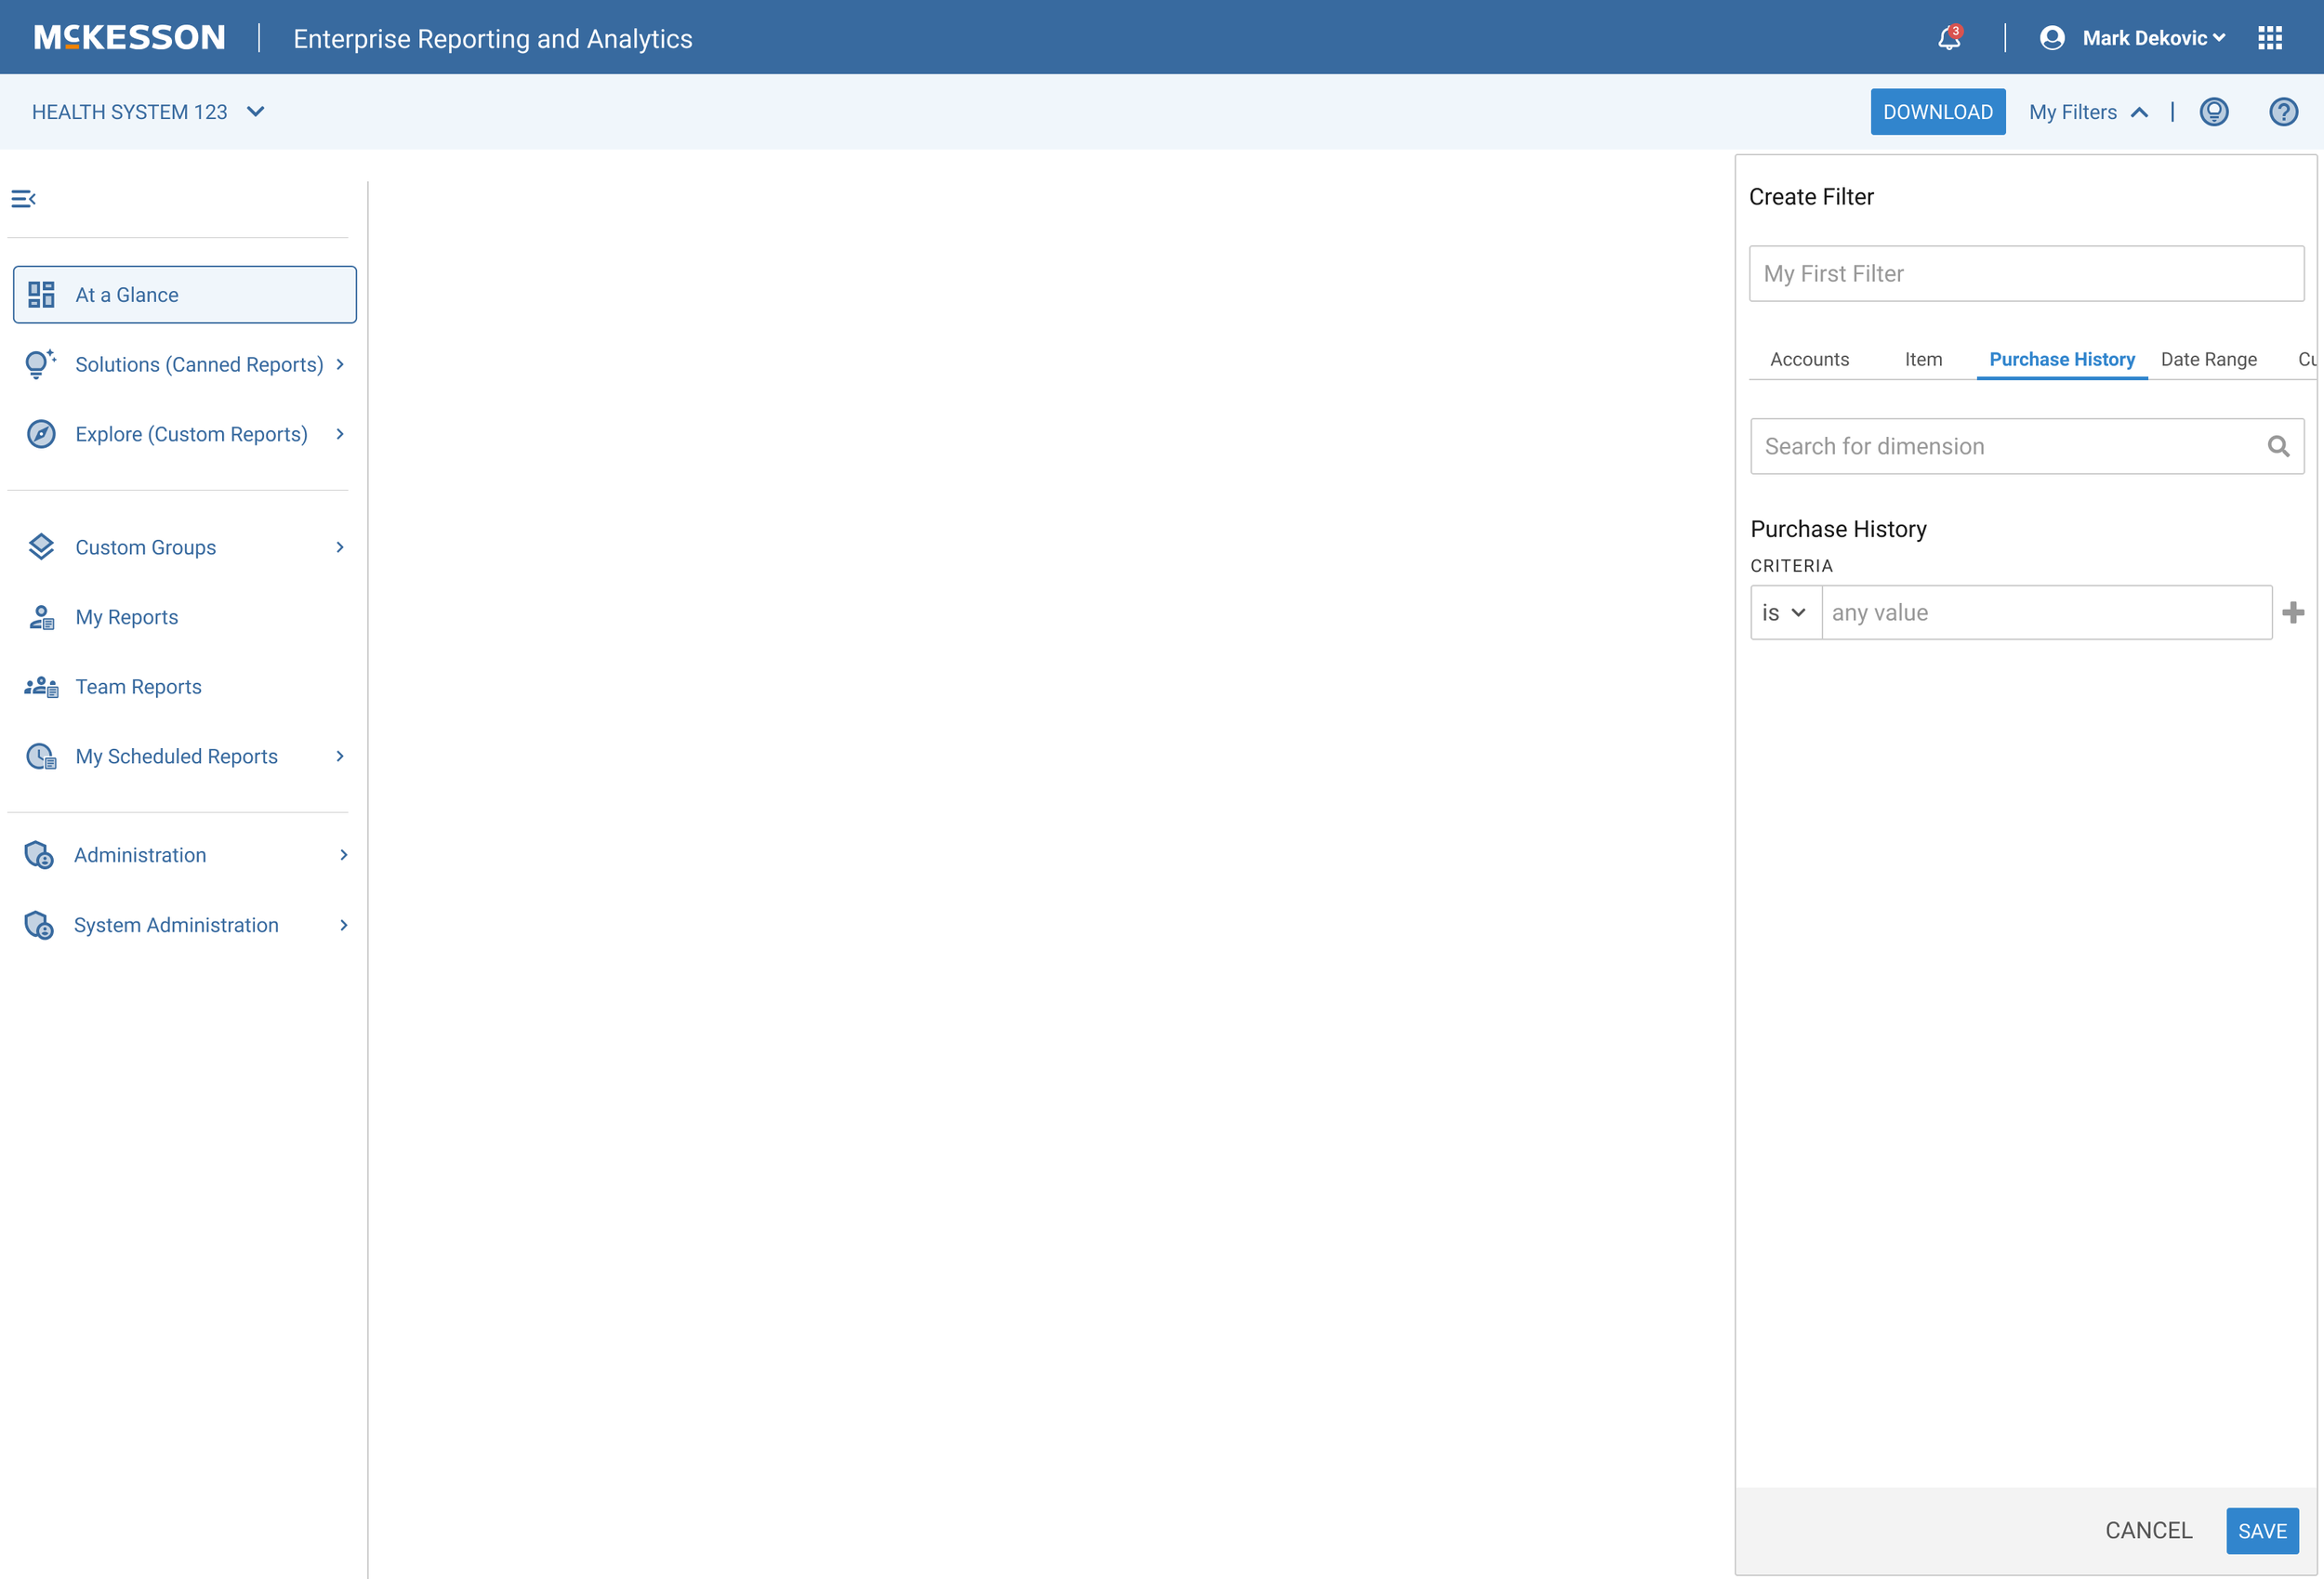
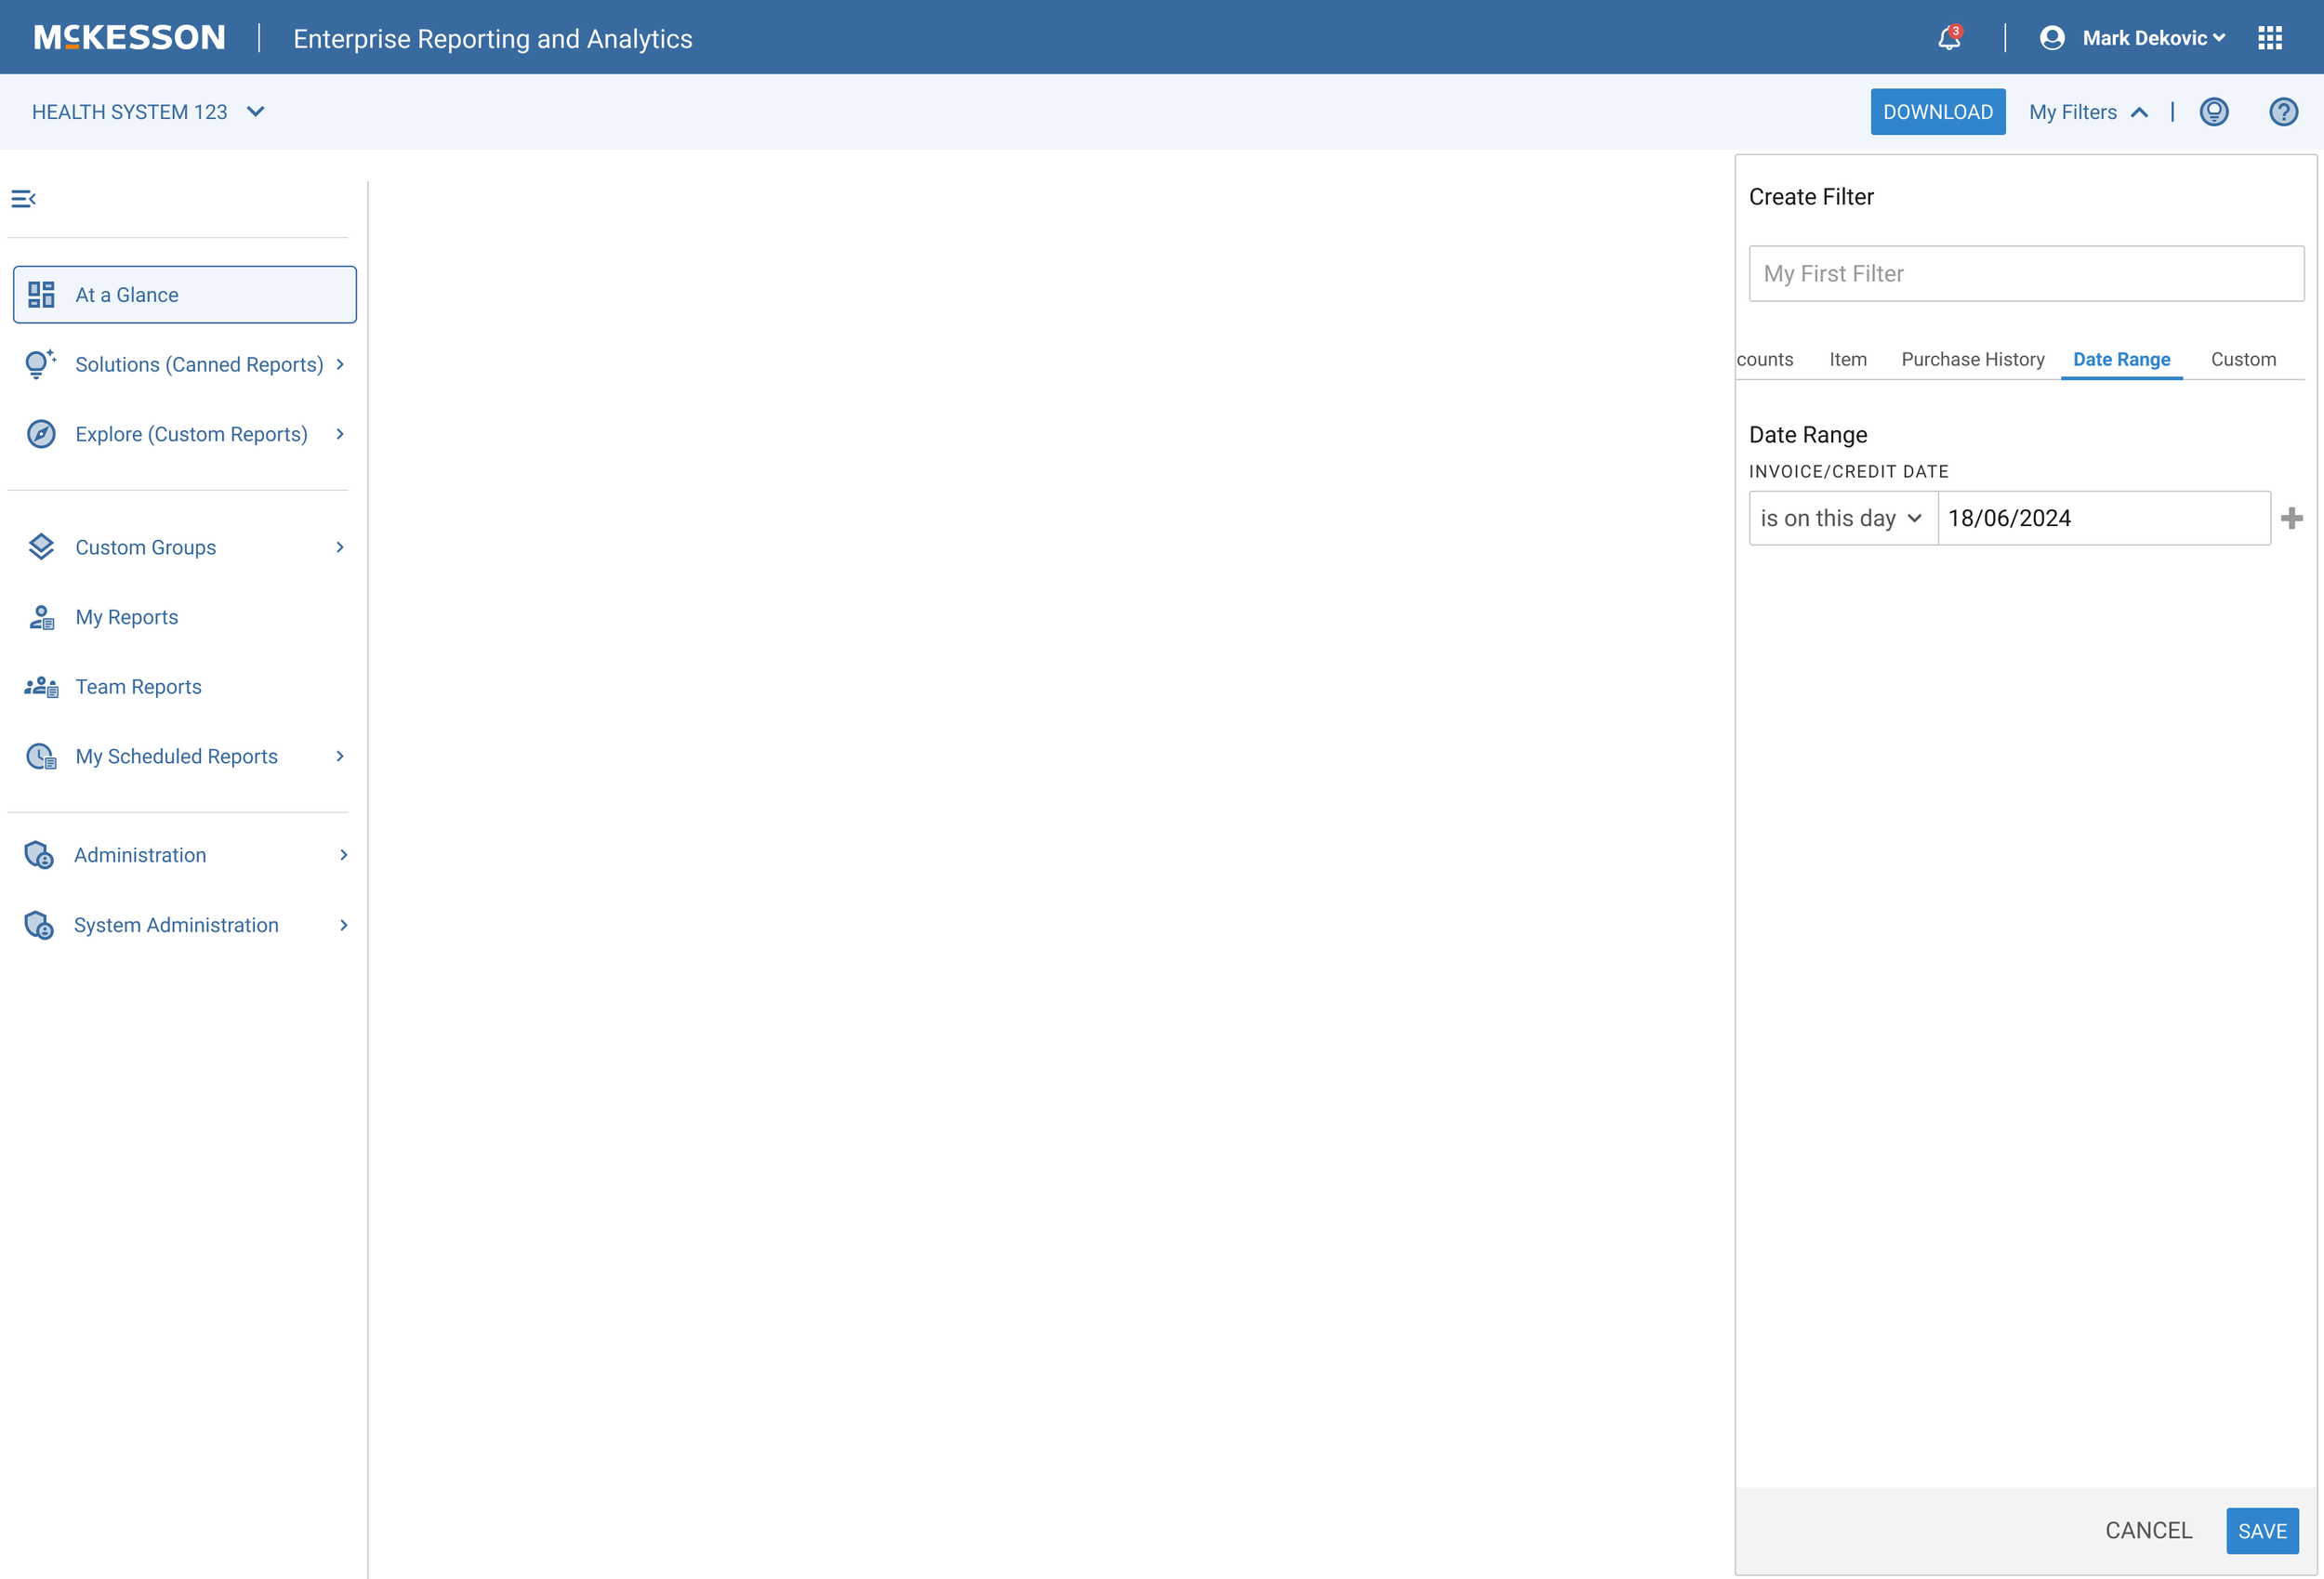
After synthesizing research insights from the discovery phase, I moved into high-fidelity wireframing to bring the new My Filters experience to life. My focus was on clarity, flexibility, and scalability—ensuring the filtering system could support a wide range of use cases without overwhelming the user.
Key Design Priorities:
Modular filtering: Designed a dynamic, collapsible filter panel with clear category groupings, enabling users to focus on relevant filters.
Persistence & recall: Introduced the ability to save, apply, and edit custom filter sets, improving efficiency for repeat tasks.
Visual clarity: Prioritized accessibility with contrast-compliant colors, clear interactive states, and intuitive labeling.
Responsiveness: Built wireframes with layout responsiveness in mind, considering both desktop and tablet environments used in clinical settings.


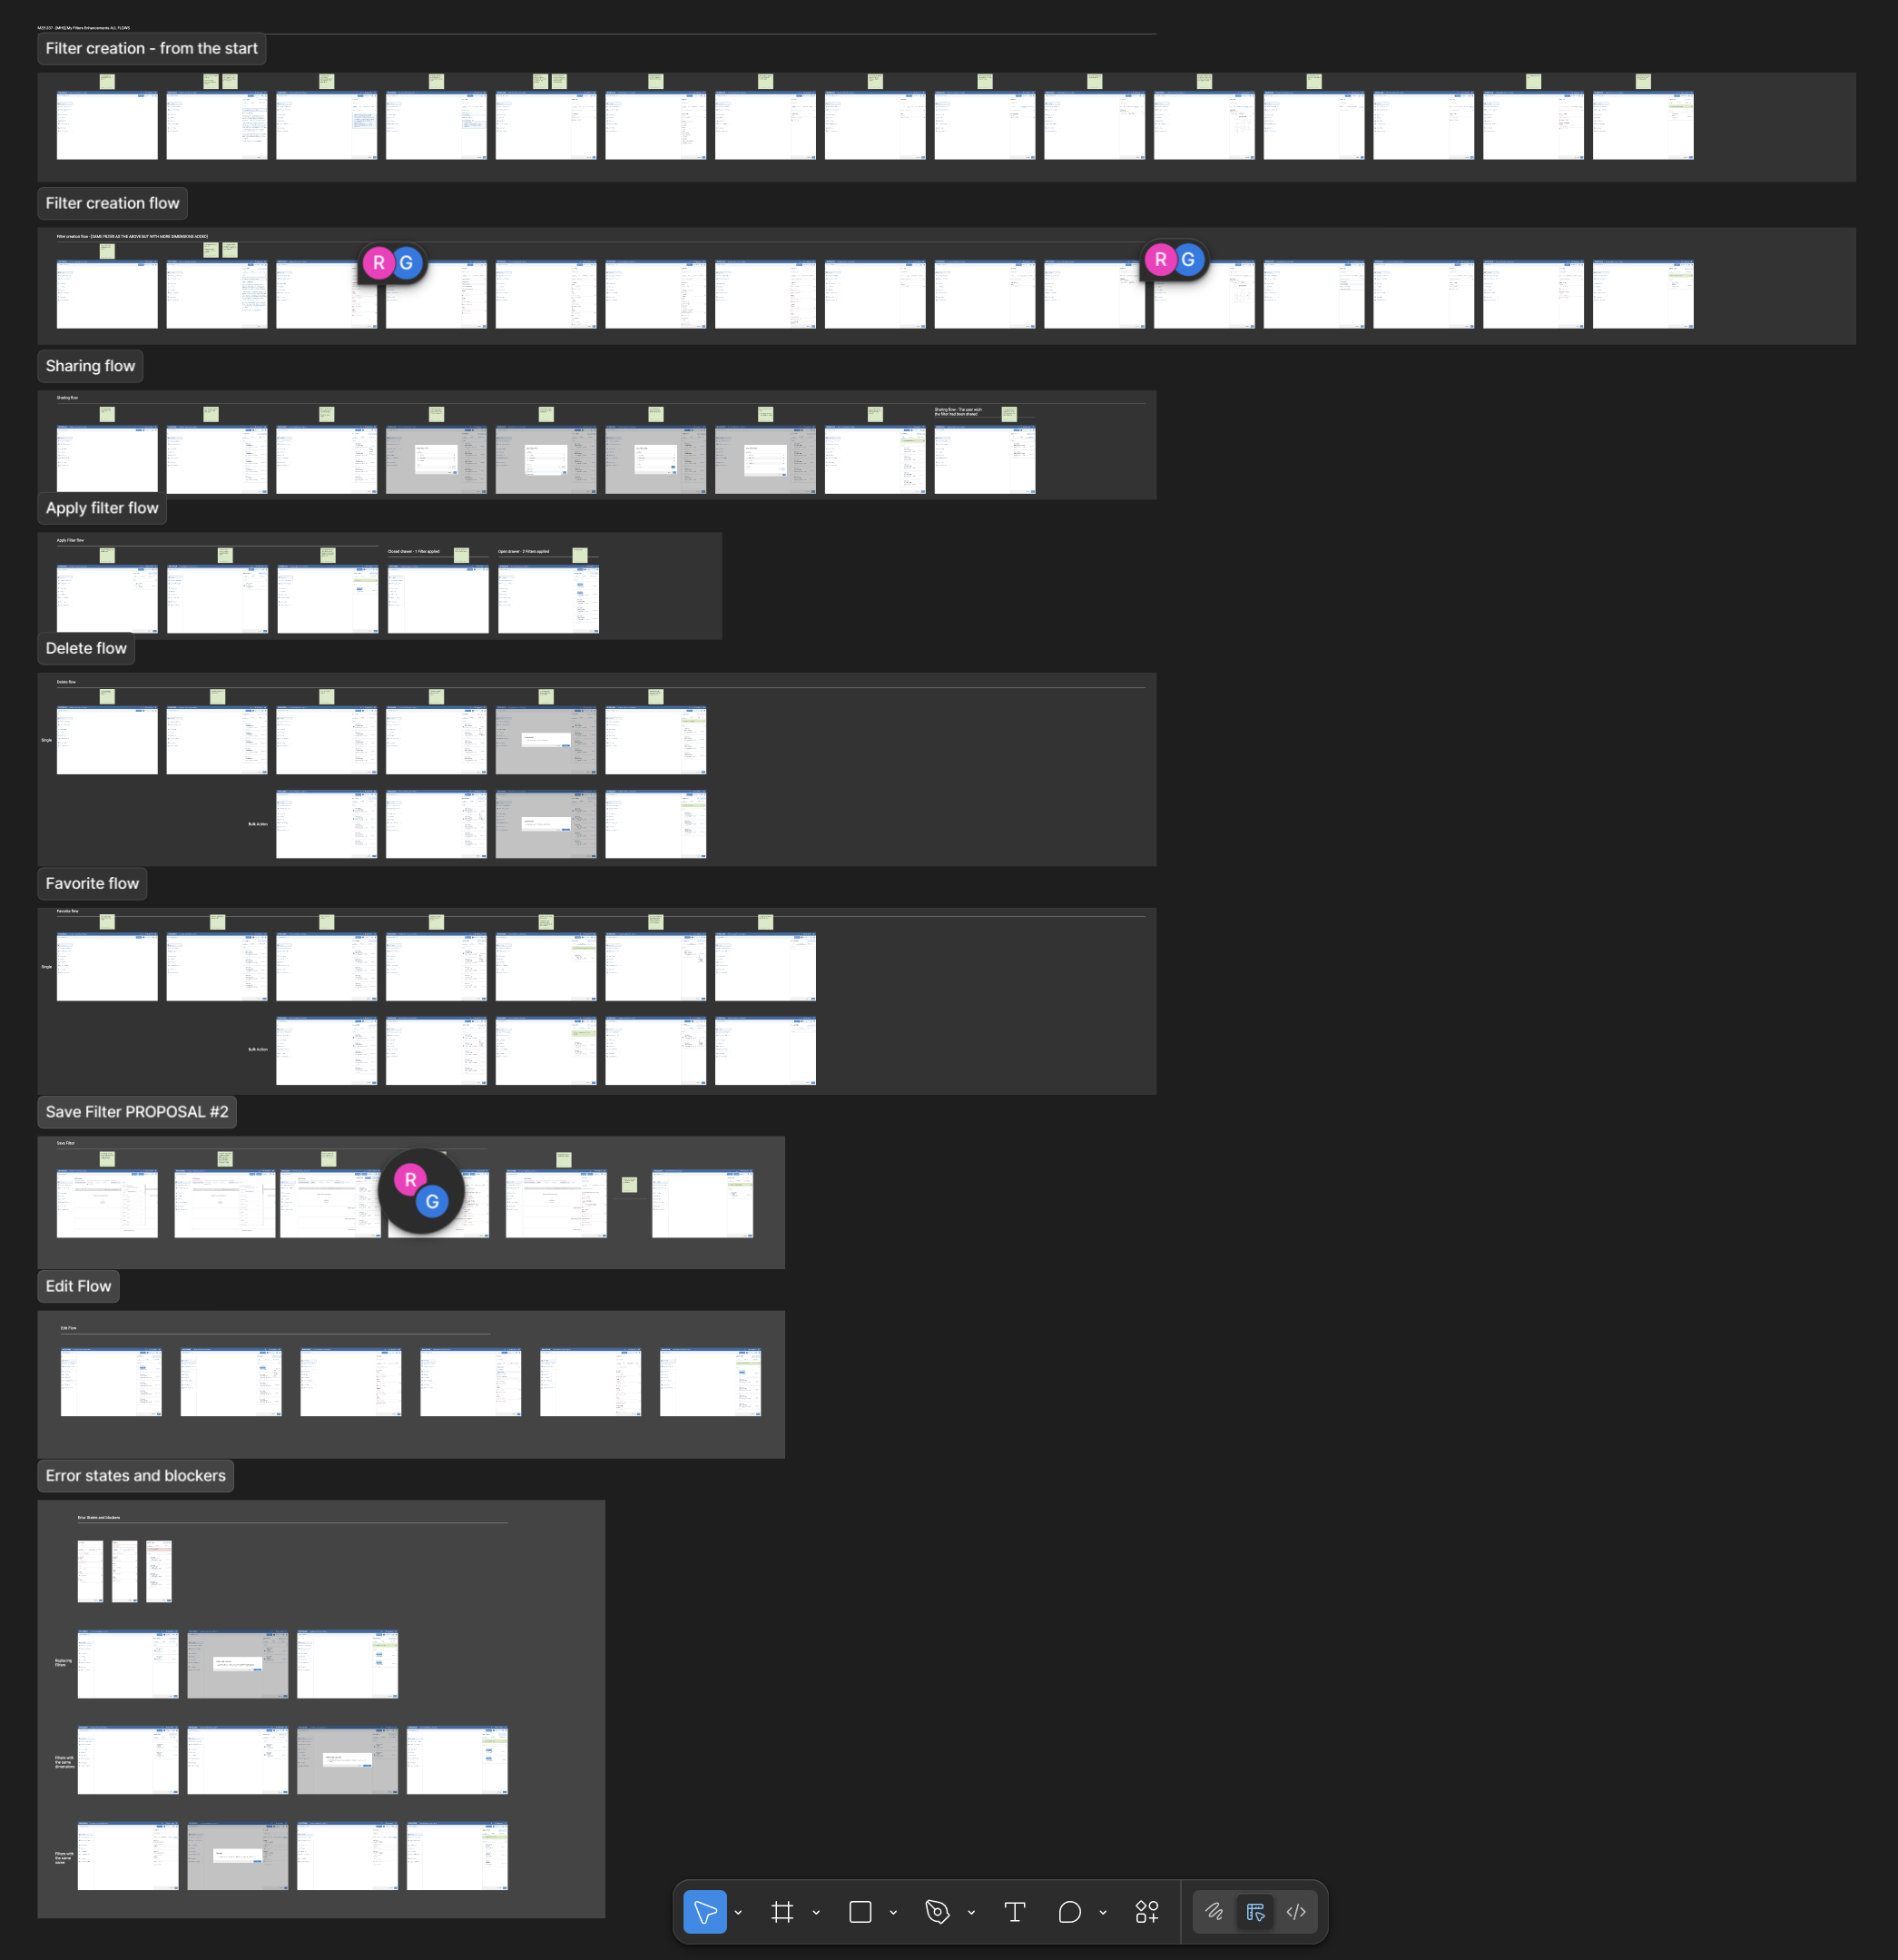
Prototyping
The prototyped flow was created to help the product team understand how the new navigation would work
Measurements of Success
As part of our strategy, we defined both quantitative and qualitative metrics to evaluate the effectiveness of the new My Filters experience post-launch. Our goals included:
Reducing time-to-filter by at least 30%
Improving task success rates and user satisfaction
Gathering feedback through usability testing and internal surveys
Tracking support ticket volume related to filtering issues
However, due to shifts in business priorities and resourcing, the implementation phase of the project was delayed. As a result, we were unable to conduct the full suite of post-launch measurements within the original timeline.
Despite this, the work remains development-ready, and stakeholder feedback on the high-fidelity wireframes has been highly positive. The design solution is well-positioned to deliver strong outcomes once implemented.