Supply Agreement Performance Dashboard — McKesson
Role: UX Designer & UI Lead
Tools: Figma, Miro
Duration: [Insert Duration]
Platform: McKesson Enterprise Reporting and Analytics (ERA) - Power BI or Looker
Team: Worked alongside the UX and research team, PMs, and stakeholders
Overview
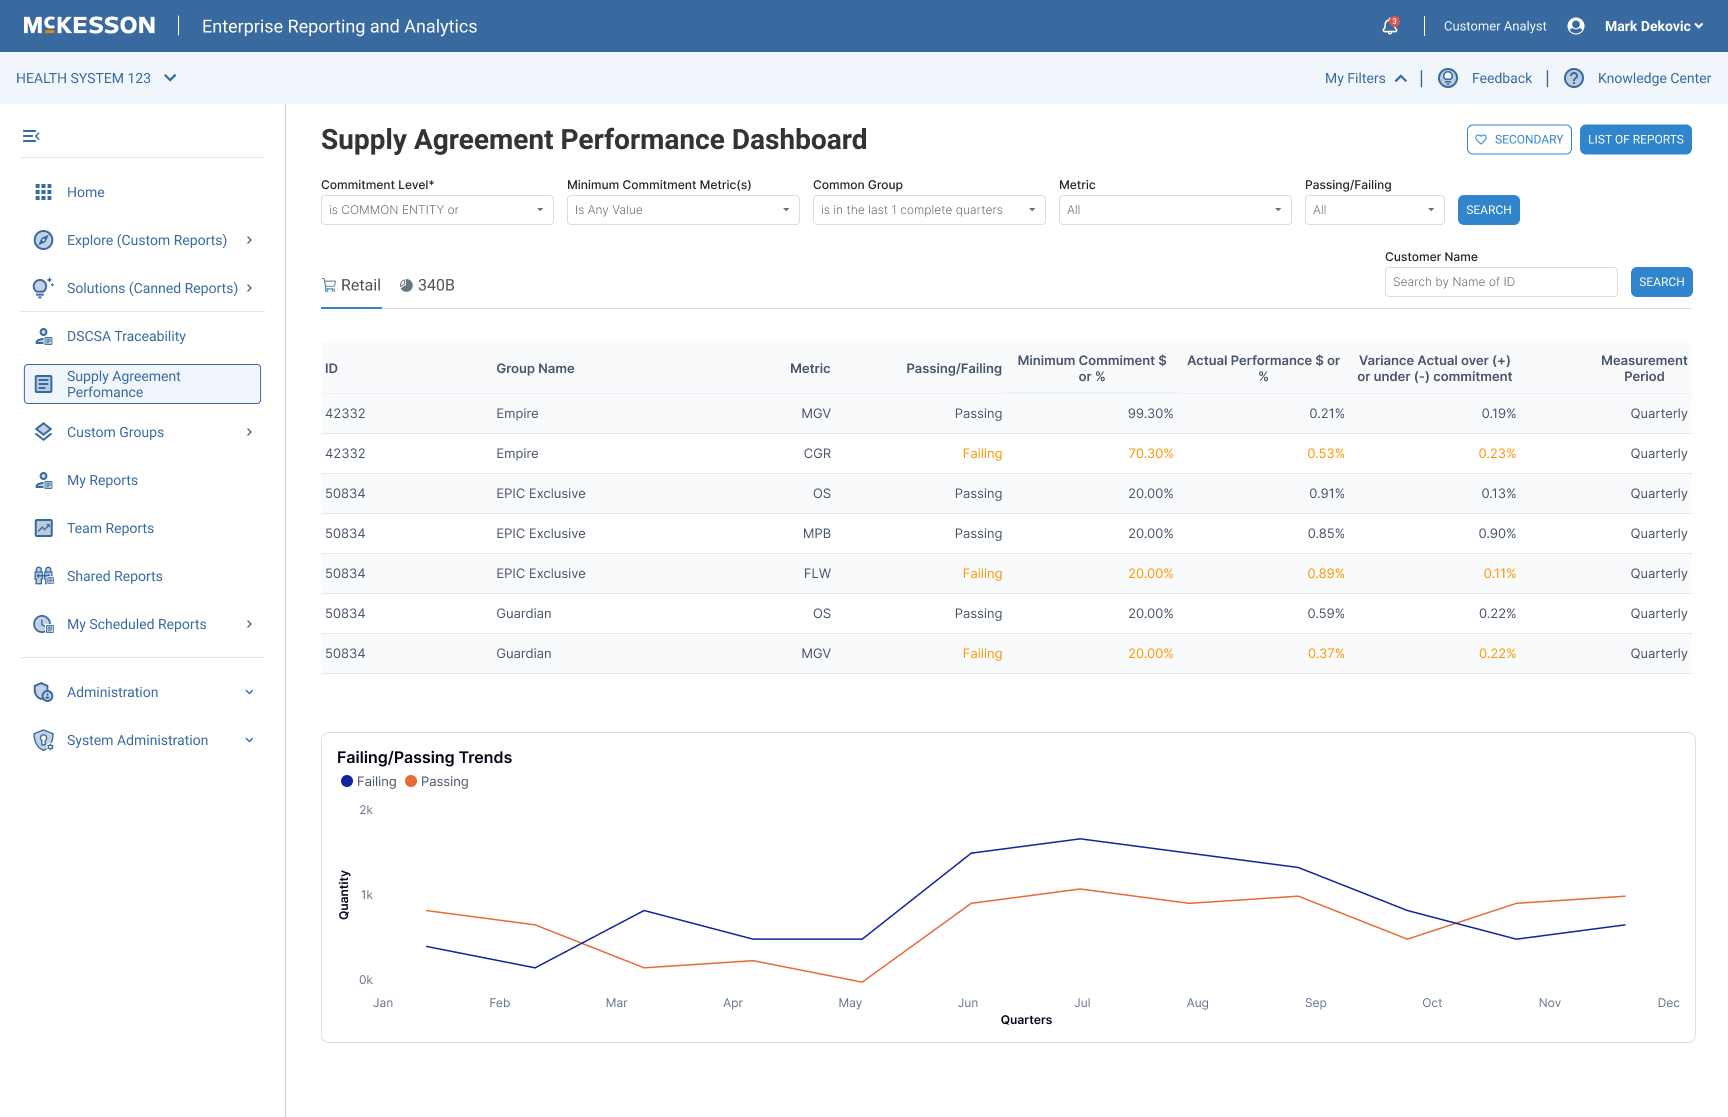
As the UX designer and UI lead on McKesson's Supply Agreement Performance Dashboard, I was responsible for transforming complex data tracking requirements into an intuitive and insightful user interface. This dashboard is part of McKesson’s Enterprise Reporting and Analytics™ platform, designed to help customers monitor contract compliance, especially regarding minimum purchase commitments across pharmaceutical and medical-surgical supply agreements.
Key Features of the Supply Agreement Performance Dashboard
Real-Time Monitoring: Provides up-to-date insights into purchasing trends, allowing customers to track their progress toward meeting contractual commitments.
Customizable Reporting: Users can generate ad-hoc reports with various criteria, schedule reports, and share them across teams. Data can also be exported to integrate with other business intelligence systems.
Data Accuracy: The platform ensures data accuracy by sourcing information directly from transactional systems, matching billing records to contracts for improved performance tracking.
User-Friendly Interface: Features intuitive navigation, clearer visualization of charts and graphs, and robust custom groupings to reflect unique needs


My Role & Responsabilities
Conducted UX research to understand user pain points and contract compliance needs
Designed user flows and journey maps to visualize dashboard interactions
Created low-fidelity wireframes to establish layout and structure
Developed detailed high-fidelity mockups aligned with McKesson’s brand and Power BI constraints

Design Process
1. Discovery & Research
Briefly mention methods: stakeholder interviews, heuristic reviews, business goals
Show artifacts (journey maps, notes, user personas if applicable)
2. Wireframes & Information Architecture
Showcase low-fidelity wireframes
Explain layout choices: "I prioritized grouping key metrics and status indicators above the fold to ensure quick decision-making..."
3. UI Design / High-Fidelity Prototypes
Display side-by-side UI screens or scrollable mockups
Highlight Power BI-specific adaptations (e.g., filter panel placement, drill-down behavior)
Mention use of components, color for status visibility, typography for clarity
4. Collaboration & Handoff
Describe working with Power BI devs
Mention accessibility or data integrity considerations
If relevant, include feedback loops or testing cycles
High fidelity Wireframes
First Ideations

Final ideations


Measurements of Success
Quantitative (if available or estimated):
Improved dashboard usability based on internal feedback sessions (e.g., reduced time to find key contract metrics by 40%)
Increased user engagement with the dashboard after redesign (e.g., +25% usage month-over-month)
Reduction in support tickets or user confusion about minimum commitment tracking (e.g., support tickets related to contract data dropped by 30%)
Faster data-driven decisions, with improved navigation and filtering in Power BI
Accelerated design-to-development handoff, reducing iteration time by 20% due to detailed high-fidelity mockups
Qualitative:
Positive stakeholder feedback on dashboard clarity and alignment with business needs
Improved cross-functional collaboration between design and Power BI development teams
Enhanced trust in contract tracking accuracy from sales and supply chain teams
Design reuse: UI components and layouts were later adopted in other McKesson dashboards